


News: Microelectronics
25 January 2024
Carbon removal for boosting GaN electron mobility
Researchers based in Japan have reported record high electron mobility performance for gallium nitride (GaN) by reducing carbon contamination to avoid “mobility collapse” from that source [Shota Kaneki et al, Appl. Phys. Lett., v124, p012105, 2024].
The team from Sumitomo Chemical Co Ltd., Kyoto University, Nagoya University and the Institute of Materials and Systems for Sustainability (IMaSS) reports that a sample with a carbon concentration ([C]) as low as 1:4x10¹⁴/cm3 exhibited a record high room-temperature mobility (μRT) of 1480cm2/(V-s) and a further record for the maximum μMAX of 14,300cm2/(V-s) at 62K. The researchers point out that their μMAX value is almost double the previous record.
The group used its quartz-free hydride vapor phase epitaxy (QF-HVPE) growth method to enable tight control of silicon (Si), C, and oxygen contamination. Quartz is crystalline silicon dioxide. The material is often used in equipment subjected to high-temperature processes.
Apart from achieving record mobility performance, the team also sought empirical understanding of the “collapse” caused by C contamination with a view to achieving the full capability of GaN in terms of more efficient and compact power devices for constructing inverters for electric vehicles and power converters for renewable energy.
Carbon contamination is a particular problem for the metal-organic III-nitride growth methods mostly used in manufacturing, where the metal ions gallium, indium and aluminium are linked with organic components to give precursors such as trimethyl-Ga. A methyl group (CH3) consists of carbon and hydrogen. The QF-HVPE method of Sumitomo et al avoids organic chemistry and hence uncontrolled C incorporation.
The researchers prepared samples for Hall measurements from materials grown by their QF-HVPE process on 2-inch freestanding GaN substrates prepared by the group’s void-assisted separation method. The test samples consisted of 6mm x 6mm squares of n-type GaN layers after the growth substrate was removed by back-side polishing.
The layer growth took between 5 hours and 8 hours, resulting in a thickness of 300-500µm. After substrate removal, the material was 200-400µm thick. The growth temperature was 1050°C and the growth pressure was atmospheric. The threading dislocation density (TDD) of the growth substrates was uniform and between 1x10⁶/cm2 and 3x10⁶/cm2.
The sample contamination consisted of a small piece of carbon placed in the flow path of the ammonia (NH3) N-source gas. The size of the carbon piece controlled the impurity concentration (Table), as determined by secondary-ion mass spectrometry (SIMS). Aluminium/titanium electrodes for Hall measurement were placed on the corners of the square samples from the center of the materials.
Table 1: The Si and C impurity concentrations, along with the results from Hall measurements for the three kinds of sample.
Sample |
[Si] | [C] | n | μMAX | μRT |
| 1 | 4.2x10¹⁵/cm3 | 2.0x10¹⁵/cm3 | 1.1x10¹⁵/cm3 | 5810cm2/V-s | 1090cm2/V-s |
| 2 | 4.3x10¹⁵/cm3 | 1.1x10¹⁵/cm3 | 2.4x10¹⁵/cm3 | 7890cm2/V-s | 1220cm2/V-s |
| 3 | 1.5x10¹⁵/cm3 | 1.4x10¹⁴/cm3 | 1.1x10¹⁵/cm3 | 14,300cm2/V-s | 1480cm2/V-s |
The temperature dependence of the Hall parameters between 20K and 300K (RT, room temperature) was used to assess the contributions of scattering mechanisms to reducing mobility, such as by ionized impurities (II), acoustic-deformation potentials (DP), polar optical phonons (POP), and piezoelectric (Piez) effects. The mobility was found to increase at vary low temperature, reach a peak (μMAX) and then fall off as room temperature was approached (μRT).
![Figure 1: [C] dependence of (a) μMAX and (b) μRT. Observed data plotted as closed circles. Red broken curves represent conventional theory, whereas red solid curves represent values calculated under the assumption of additional mobility component, μUNK.](24014_sumitomo_f1.jpg)
Figure 1: [C] dependence of (a) μMAX and (b) μRT. Observed data plotted as closed circles. Red broken curves represent conventional theory, whereas red solid curves represent values calculated under the assumption of additional mobility component, μUNK.
The researchers compared their data with conventional theory for μMAX and μRT dependence with carbon concentrations (Figure 1). At the low temperatures of μMAX, the dominant mobility contribution was from impurity scattering. Although the measured values were lower than the conventional expectation, the difference was relatively small. However, at room temperature phonon scattering is expected to dominate in its impact on mobility, but the measured results continued to show a large impact from the presence of carbon, giving a “mobility collapse”.
The team empirically attempted to characterize the “unknown” impact on mobility in a term, μUNK (Figure 2). Total mobilities were calculated without and with an unknown (UNK) component varying as T−1.5, respectively. A variation with temperature as T−1.5 improved the fit.
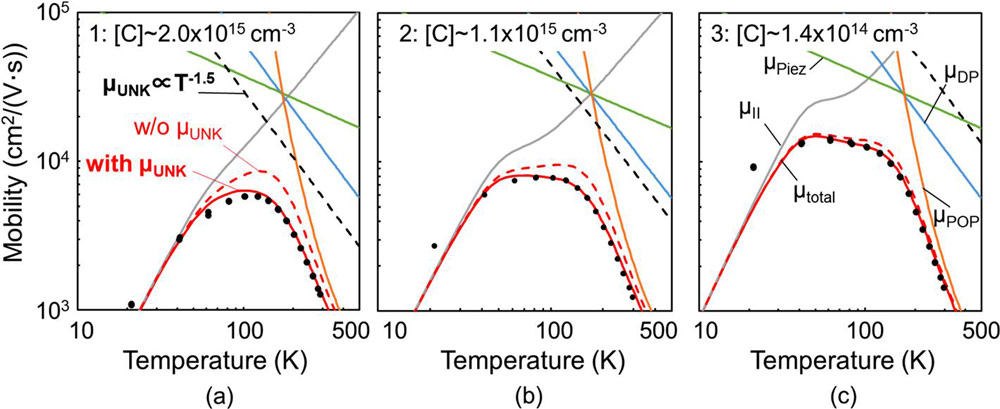
Figure 2: Hall mobilities as a function of temperature for samples (a) 1, (b) 2, and (c) 3. Black filled circles represent experimental data. Gray, blue, orange and green solid curves are calculated Hall mobilities for μII, μDP, μPOP and μPiez components, respectively, without (broken) and with (solid) μUNK.
One must remember that mobility contributions, at least in simple theories, combine in inverse sums (Σi1/μi) to give the inverse of effective mobility (1/μeff), since increased “scattering” reduces carrier mobility.
The variation of the size of the added contribution, μUNK = K/T1.5, was fitted approximately by a 1/[C] trend (Figure 3). Temperature exponents for μUNK between 1 and 2 provided similar capabilities in terms of fitting the experimental data.
![Figure 3: Relationships between pre-factor K for μUNK and [C] for samples 1–3, together with data from previous reports.](24014_sumitomo_f3.jpg)
Figure 3: Relationships between pre-factor K for μUNK and [C] for samples 1–3, together with data from previous reports.
The team comments: “Because the ionized impurity scattering has already been considered in the conventional theory, the [C] dependence of K in [(Figure 3)] strongly indicates that the carbon impurity induced an extra scattering mechanism other than the ionized impurity scattering. A scattering due to local strain around a deep-C acceptor is one possibility.”
The author Mike Cooke is a freelance technology journalist who has worked in the semiconductor and advanced technology sectors since 1997.